IN THE EVENT OF LACK OF CONNECTIVITY OR SERVICE INTERRUPTION:

- Information about the port’s status (Up/Down) and the timestamp since the last change.
- Information about the last drop/interruption and how many times this has happened since the service problem was first observed.
- The approximate time which the service problem started at and if it is related to the peak traffic hours.
- The logs of the Router / Switch / Server, where the connection with Telepoint terminates at, along with timestamps with the correct time zone (GMT).
- A check of the received optical levels, DOM statistics of the physical interface, CRC statistics on the port counters.
- Information on the configuration for Speed/Duplex settings – 10/100/1000, Auto Negotiation on/off.
- In the case of working with an optical interface, it is needed to submit information on the used module.
- You can ask Telepoint to check for a faulty cord, connector, optic level, etc. in case of a physical issue.
IN THE EVENT OF PACKET LOSS, LOW UPLOAD/DOWNLOAD SPEEDS
- Submission of the traceroute results with the source/destination IP addresses to the problem destination.
The results should be provided without “resolve” for the IP addresses to be visible at the different hops.
- Windows: tracert google.com
- Linux: traceroute google.com
- For Linux based systems you can use MTR for these tests.
Note: Most Core routers which your traffic passes through do not prioritize the ICMP protocol responses used in a ping test. For that reason, and due to other factors, you might observe losses in your tests of the in-between hops. This is completely normal and is not a reason for the issue you are observing. Your tests can show a problem on a network level if they have losses to the end destination IP. If that is the case, it is necessary to check your connection. Please test towards other destinations, international and Bulgarian based, when submitting them.
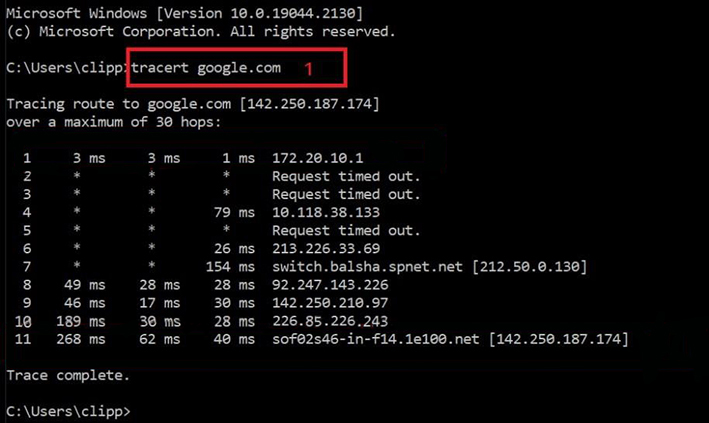
The Windows command is tracert followed by the destination IP / Domain Name. On Linux it is traceroute. The logic in the results is the same, regardless if we are using Linux or Windows. We can use either Domain Name or IP. The DNS is going to translate it.
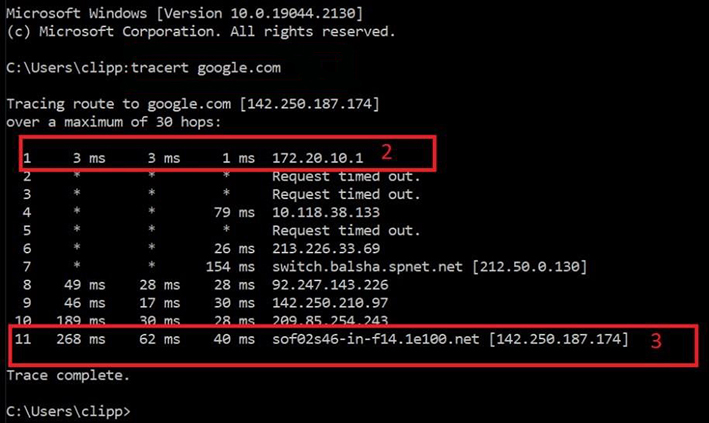
First is the HOP number. It shows us which HOP are we on in the connection path. The most important thing here is to check the three numbers following it. They show us the RTT (round trip time), meaning how long it takes for the packet to arrive at its destination and return back to our device. The measuring unit is ms (milliseconds). The columns are three because the traceroute sends three messages in total for better consistency. The last column after the three numbers is the device’s IP address and domain name on the corresponding HOP. In the middle of the test we can see Request time out but it is not always a cause for trouble. Some devices simply block packets from traceroute or ping (Windows – ICMP / Linux – UDP). The times in the RTT columns are an important thing to observe in this test. If we determine a high latency in the first few HOPS, then it means we could have an issue on the local LAN level. If we find out a high latency level on a certain HOP and it continues with a constant increase, then that could indicate a problem at the point where the increase first began.
In our case 11 is our last HOP, the default tracert is 30 HOPS maximum. If we want to increase the default HOPS we can use the parameter -h followed by the number of HOPS.
- Another tool which we can use is MTR. It combines traceroute and ping.
- A check and information on the counter for interface errors (CRC) is required, as well as when did the error accumulation and port overload started. A faulty UTP cable can be the reason why a port works on 100 Mbps instead of 1 Gbps.
- Interface speed test 10/100/1000.
- Submission of a Bandwith test and if possible please use a public Iperf Server and download a large size file (Linux destro). If necessary, you can get in touch with NOCTelepoint and we can provide you an Iperf Server in our network for testing. In the case of a Mikrotik Router we can provide a Btest server.
Iperf is a client-server bandwith test tool between two hosts. It can be used both on Windows and Linux, usually only with CLI. On one side we have a server that “listens” by default on port 5201. To start the server we use the command: iperf3 -s. If we want to change the port the server “listens” on we can use the parameter -p. On the other side the client needs to use the following command to connect to the server and start the test: iperf3 -c the server’s IP. After a few seconds (10 by default) we will see the results. If we want to increase the test’s duration we use the parameter -t.
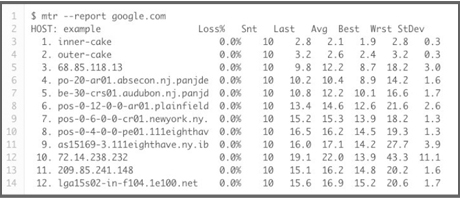
It is much more detailed than Traceroute and shows us the packet loss percentage on the different HOPS. MTR can be used with Windows, Mac OS, and Linux. To use MTR with Windows you will need to download the Windows version WINMTR. To install MTR on MAC OS you can use Homebrew and Macports. Depending on the specific Linux distribution you can install with the following commands: apt-get install mtr or yum install mtr (RHEL, Fedora).
IN THE EVENT OF AN ISSUE AFFECTING THE CONNECTION TO/FROM ONE OF THE SERVERS IN THE NETWORK TOPOLOGY:
- Submission of the network topology from the server’s viewpoint. Example: Server <> Switch <> Router <> Telepoint Gateway.
- Submission of the tests from the problem server as well as the repeated results from a server without a noticeable problem.
IN THE EVENT OF NO INTERNET CONNECTION BUT A SUCCESSFUL PING TO A GATEWAY IP ADDRESS:

- Verification and information on the activated IP addresses of the Router / Server device relative to the provided network and the default gateway (0.0.0.0/0) configuration. The most common reason for these symptoms is the lack of or incorrectly set up default gateway.